Related


Collaboration, increased transparency and supporting communities were high on funders agenda in 2021
To help inform the work of funders across London, we’ve been asking our members where and what they fund. We’ve done this through our annual member audit, which was completed by 58% of our members (99 respondents). To map out how this is changing over time, we’ve also been looking at data from our 2020 members audit as well as the data from ‘After the Storm’ – a report we released in December 2020 which set out the priorities and challenges funders were thinking about at the time. Here is what we found (you can look at the data in more detail here).
What areas in London did funders invest in 2021?
While 57% said they can fund all London Boroughs, only 37% of respondents did fund all London Boroughs. The five most commonly funded boroughs from those who responded to our survey were: Tower Hamlets, Southwark, Islington, Hackney and Lambeth.
Comparing this to income deprivation rates within London boroughs, it’s clear that funding from our members goes to some of the most deprived boroughs in the capital
Comparing this to income deprivation rates within London boroughs, it’s clear that funding from our members goes to some of the most deprived boroughs in the capital – Tower Hamlets ranks as the most income deprived borough, with Hackney the third, Islington fourth, Southwark fifth and Lambeth the eleventh. While our data did not capture whether this is a deliberative strategy from funders, it is the case that funding are going to those areas where income deprivation are highest.
The five boroughs who were the least likely to be funded by our members were : Havering, Merton, Hillingdon, Bromley and Kingston upon Thames. Again, looking at income deprivation rates, Merton, Havering and Kingston upon Thames all rank relatively low on the most deprived London boroughs.
Looking at previous year’s audits Lambeth, Tower Hamlets and Islington are consistently funded by more funders whilst Merton, Havering and Hillingdon have remained cold spots.
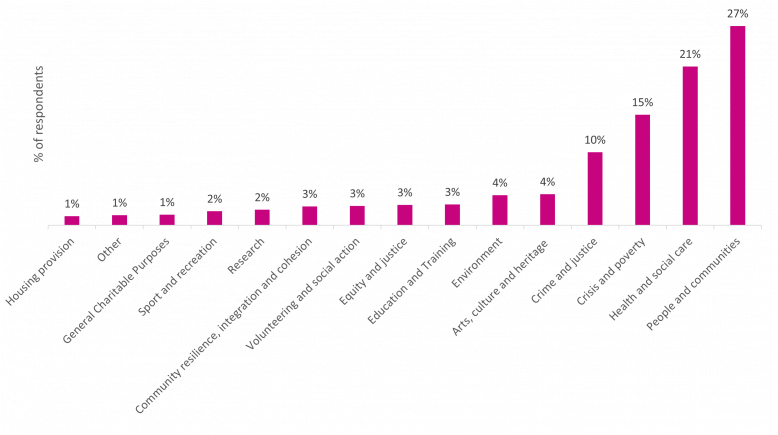
The themes which most funders said they funded was ‘People and Communities’ (27%). Breaking this down, our findings show that children and young people were most likely to get funding (17%) within this area, followed by disability (12%), older people (12%), refugees and asylum seekers (12%), race and ethnicity (11%), women (11%), faith groups (7%). While our member audit from early 2020 shows that supporting different communities was already a priority pre-pandemic, this year’s audit shows increased funding to crisis, poverty, crime and justice.
The findings from this year’s audit is also part of a wider trend we’ve seen through the London Community Response and ‘After the Storm’ – with funders focused on supporting those most affected by the economic and health impacts of covid in the last year.
The second area which is most funded by our members are ‘Crisis and poverty’ (15%). Again, breaking this down, the most commonly funded areas were homelessness (20%), followed by advice and advocacy (20%), unemployment, employment support (19%), hunger/ food banks (19%).
Fewest respondents funded housing provision (1%), general charitable purposes (1%), sports and recreation (2%) and research (2%).

Building on this data and the wider learning from coordinating funder responses to emergencies, we know that collaboration at pace and scale is possible
The member audit we carried out in early 2020 showed there was a strong appetite for funders to collaborate, with 70% saying they were ‘always interested’ in doing so. This interest was translated into real action once the pandemic hit, with 67 funders from across sectors coming together to support London’s communities collectively through and beyond the crisis through the London Community Response.
Looking beyond the immediate covid-19 crisis, it’s clear that this appetite for collaboration remains. This was reflected in our ‘After the Storm’ report published back in December 2020, which found that there was a desire to build on the collaboration from the London Community Response – by “aligning rather than pooling their funds, with mechanisms that reduce inefficiencies and help funders understand what their peers are doing”. A year on and with a large scale funder collaboration like the London Community Response partnership behind us, this year’s audit tells us the desire remains the same – with 71% of respondents saying they were ‘always interested’ in collaborating with other funders.
Building on this data and the wider learning from coordinating funder responses to emergencies, we know that collaboration at pace and scale is possible. We also know that the challenges facing London – from structural inequalities to the climate emergency – require long-term funder collaboration. On this basis, we’ve developed proposals for collaborative action for recovery, setting out why and how funders can collaborate beyond the crisis, you can read more about that here.
In our 2020 member audit, 33% of respondents said they shared their data using the 360Giving Standard – by 2021, this was up to 45% - suggesting that more funders are recognising the value that sharing their data has to make more grantmaking more informed and joined up.
We know from our own experience (and a steep learning curve during the pandemic) how important data is in driving decision making and adapting to changing circumstances. Indeed, data was critical in shaping the five funding waves of the London Community Response and the pro-bono support we received from our friends at DataKind UK allowed us to share what was happening with partners and narrow down the criteria for the next waves of funding.
We’re working on sharing our own data in an even more interactive way so stay tuned for more data details in the coming months

